Objective: Define what a time study is, why it is important, and how to conduct one effectively.
What is a Time Study?
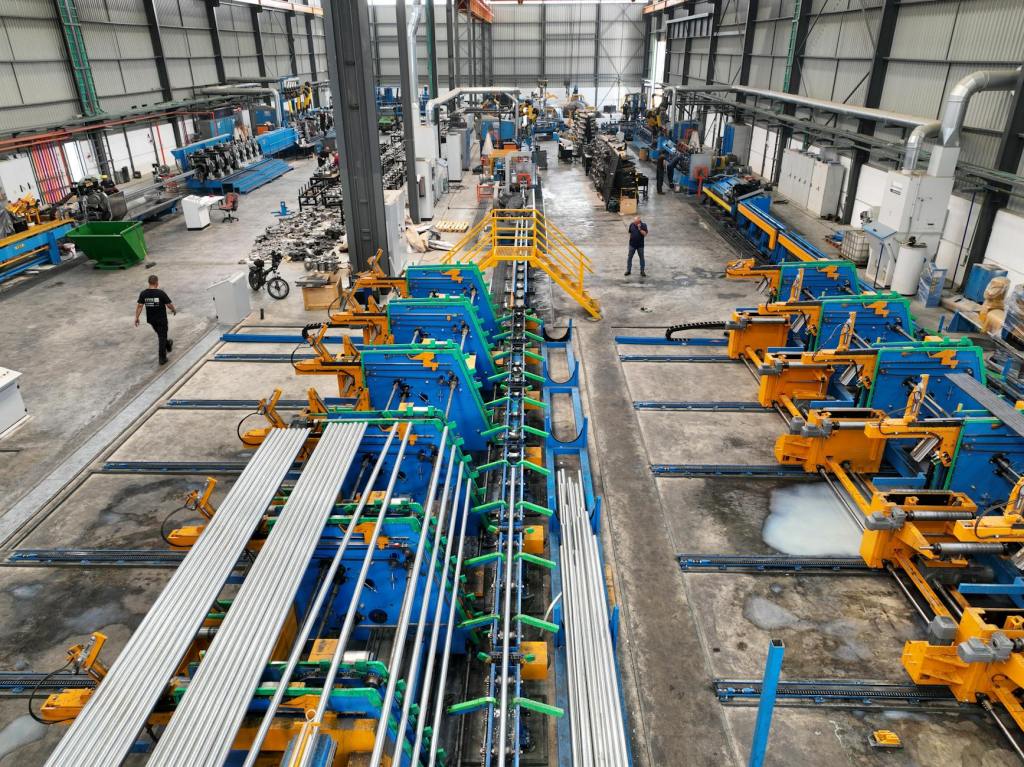
A time study is a formal evaluation of a work process. Typically done by an Industrial or Process Engineer, the overall goal of a time study is to determine how long a certain process takes. And it can be any process. Tightening a screw, loading a dishwasher, cooking a steak, changeover times for a car part, getting riders off and on a roller coaster, etc…
Why are Time Studies Important?
We might as well start with a painful truth: Time is Money. If you do not understand where your time is getting lost, you also cannot understand how your money is lost.
Let us illustrate this point with capacity planning, using ticket scanners at an amusement park as an example. During the first hour that the park is open, 1000 people arrive to enter through the gate (uniformly distributed across the hour for the sake of simplicity). How long would it take to scan 1000 tickets if you do not know how long each scan takes? Here a time study can provide the average scan time, how long it takes each guest to go through the turnstiles, etc.
Once you have determined how long it takes to scan each ticket, you can determine how many employees you will need to scan tickets in that first hour. If each scan takes 30 seconds, that employee can do 120 scans/hour. If 1000 guests arrive in the first hour, you will need 9 scanners. If you have fewer employees, guests will be waiting when they could be spending their day screaming on roller coasters, resulting in potentially losing repeat customers. If you have too many employees scanning, you are wasting labor costs. Operating away from the optimal number of employees runs financial risks in either direction.
So how do we do a time study?
Step one: Identify the information you want to obtain.
Sounds elementary but this step is incredibly important. What exactly are you looking for? Do you want to define an engineering standard for a manual manufacturing operation? Are you wanting to see if an employee is deliberately underperforming? Or if the machine is running slow?
Take the time to deeply understand the information you are looking for. Then write down the statement so your time study is defined like this:
Evaluate the process steps involved and the time required to complete a label application changeover.
Determine the variance in hotel room cleaning times after guests have checked-out.
Set a process rate for loading shampoo bottles into shipping boxes.
Step Two: Talk to the person doing the job you are looking to time study.
This step cannot be missed. When performing a time study, you want to be sure you are capturing every single step in the operation. Each step will be its own element in the time study.
You will be looking for the following information:
- What are all the process steps?
- What process steps are they struggling with?
- What steps do they have to focus hard on or make mental decisions on?
- These always come with higher variability in time and quality.
- What is the periodic work?
- How often do they have to do periodic work?
- What certain issues/defects/errors do they have to look out for?
When in doubt, try the process for a few cycles.
All the above information plays a major role in setting the overall process rate. Mental energy and high variability decreases the process rate every single time. So does periodic work that may get missed if you only stand there and watch them.
There is also a major upside that cannot be understated: you start to build a rapport with the employee. This will come in handy later down the road, and it improves your reputation. Relationships with operations are what separates the good/adequate engineers from the great ones. And the great ones get paid more…
Step Three: Write Down all the Process Steps.
Goes without saying, but these should be written in order as it tells you exactly what one cycle is. Going back to the amusement park ticket scanner example:
Step 1: Employee scans ticket.
Step 2: Scanned guest moves through turnstile, next guest walks up to employee.
Breaking down the process steps this way immediately identifies what steps the employee can control, and what is out of their control. They can be an A+ scanner, but if the guest takes their sweet time walking through the turnstile, this will impact the process rate.
This is also another good check for you to make sure you thoroughly and completely understand the process prior to devoting a lot of time observing it.
Step 4: Determining how many cycles you need to observe.
In order to conduct an effective time study, you will need to determine how many cycles you will need to observe. The number of cycles you need will be influenced by the following:
- How many cycles are performed between periodic work?
- All time studies need to include timing periodic work. Period. (Pun intended).
- How many elements are in each cycle?
- What elements did the operator identify as the most difficult?
If a cycle includes 20 different steps, timing 50 cycles might take a few hours (or days). But it might be worth it. If a cycle includes 2 steps with periodic work after 50 cycles, then timing 200 cycles will tell you a good story of the process.
There are statistical tools that can tell you how many cycles you need, which can be highly effective. But my general rule is: the more cycles, the merrier. If you study more than 10 cycles, you are more likely to identify variabilities in the process that can impact process time. My general rule is to shoot for 100 cycles and 3-4 periodic work cycles unless the cycle is longer than 60 seconds. A good time study should take around 2-3 hours. That will give you enough samples and general knowledge of the process to develop a deep understanding of what is going on.
Step 5: Record the process.
This is for if the cycles are short and you have a camera. You will be able to revisit certain steps instead of having to go out and get more data. If you do not have a camera and the cycles are a little longer, skip to step 6.
Step 6: Make a table to fill out for the time study.
Either write it out on a notebook or build it in excel. I typically build mine with the elements written on the left, then record the times to the right. Print or write out as many tables as you need. Tables with this exact format are available online.
Here is an example:
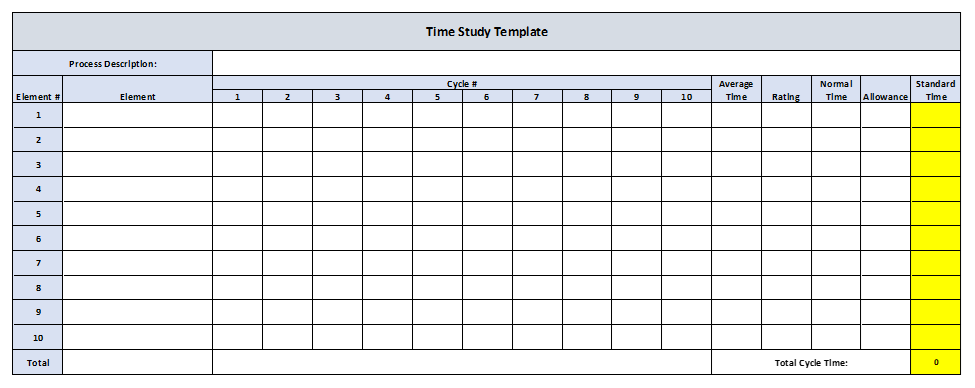
Like the template? Get it here.
Step 7: Perform the Time Study.
With your stopwatch and your notebook (or laptop), time each element for the quantity of cycles identified in step 4. Be sure to take notes on your intuition of operator performance. Did they appear to be lollygagging, working too hard, or just right? This plays a major factor in overall process rate. A guide for rating performance is in the reference section, item number [1].
Step 8: Document the element times.
Shortly after you collected the times, enter them into an excel table. This gets the data onto the computer and off the notebook. Plus, just as writing notes in class helps you retain information, entering this data into the computer helps you further your understanding of the data you just collected.
Step 9: Calculate Average Time Per Element.
Calculate the average time for each element. For the periodic work, I like to take the average time of each periodic work element and divide it by the number of cycles between periodic work. Ex: If reloading labels takes 50 seconds and happens every 25 cycles, the average time per cycle is 2 seconds.
For our amusement park example, lets assume the following average times per element.
Element 1: Employee Scans Ticket: 15 seconds.
Element 2: Guest Navigates Turnstile: 16 seconds.
Step 10: Calculate Normal Time Per Element.
You develop a normal time to factor in employee performance. An underperforming employee will have a faster normal time that what was observed. The opposite is true for an overperforming employee.
The normal time is the average time multiplied by the performance rating. The Performance Rating is a value that you will assign that adjusts the average observed time, by how you perceived the performance of the employee against the standard process rate. If a standard process rate does not exist, use your intuition. The Westinghouse System of Rating is a very powerful tool in determining the performance rating, and is largely available online [1].
The formula looks like this:
Average Time x Performance Rating = Normal Time.
Lets continue the amusement park scanner employee example. Since Element 1 is the only part of the process that is in the employees’ control, we will only assign a performance rating to Element 1. Element 2 will receive a performance rating of 100% by default.
Element 1 had an average time of 15 seconds. Their employee skill and operating conditions were average, but their effort and consistency was poor (sore from hitting the gym too hard the night before). Using the Westinghouse System of Rating [1], we would subtract -0.17 for poor effort, and -0.04 for consistency, from 1. So their performance rating would be a 0.79, or 79%.
Their normal time would look like this:
Element 1:
Average Time of 15 Seconds x 79% Performance = Normal Time of 12 Seconds.
Element 2:
Average Time of 16 Seconds x 100% Performance (since this was out of their control) = Normal Time of 16 seconds.
Step 11: Calculate Standard Time.
This step applies Personal Fatigue and Delay (PF&D) Allowances to the normal time. These allowances are defined as job-design factors that contribute to a slower process rate over time. Some factors contributing to PF&D allowances are a standing job, low-light, high heat, etc. Each allowance increases the normal time by a certain percent. These range from 3% up to 12% [2].
A good resource for these allowances can be found at item [2] in the reference section.
Element 1 of the amusement park ticket scanning job would have a standing job and high heat allowance, increasing the normal time by 15%. We would sum up the allowance percentages, subtract it from 1, then divide the Normal Time by that difference.
The amusement park ticket scanner standard time would be calculated like this:
Normal time of 12 seconds / (1-0.15) = Standard time of 14.1 seconds.
This time of 14.1 seconds would be the engineering standard for scanning a guest ticket. The engineering standard time for guests navigating the turnstile would be 16 seconds, as there is no need to apply allowances to a task that the employee is not involved in. Adding the two standard times together gives an overall standard time for the entire cycle of 30.1 seconds.
It would be this number that would be used to determine resources and capacity. Do yourself a favor and convert this to decimal minutes, it makes the process rate calculation a bit simpler. Our example would be 0.51 minutes.
We would then determine the process rate of 1 employee by dividing 60 minutes by the process time of 0.51 minutes.
60 minutes/0.51 minutes = 117 guests/hour.
If we have 1000 guests arriving in the first hour of the amusement park opening, at a fairly consistent rate, we would determine the number of employees needed like this:
1000 guests per hour / 117 guests per hour = 8.54 employees.
Since 0.54 of a person does not exist, we round up to 1. The amusement park would need 9 employees scanning tickets in the first hour to keep up with arriving guests.
Step 12: Identify Opportunities to Improve the Process:
After you have calculated the standard times, ask yourself: What parts of the process can be improved? Be sure to brainstorm ideas that impact all aspects of the process. This would include technology, equipment, ergonomics, training, etc.
For the amusement park scanner example, we could make the following recommendations:
- Investigate technology to improve the scan time, as 14 seconds for ticket scan and validation is too high. The scanning device should be able to validate the ticket within milliseconds.
- Provide chairs for employees to eliminate the need for standing, and reduce the standing allowance.
- Investigate different equipment that serves the same purpose as turnstiles, but can move guests through faster than 16 seconds. This can be justified through labor savings.
Step 13: Communicate the Standard and the Recommendations.
Brief the employee and management of the time study results, and the opportunities for improvement you identified. This gives management a standard to evaluate their employees against, allows them to see the study and ask questions (helps with that engineer – employee rapport), and provides a starting point to implement recommendations.
References:
[1] “Time Study Determining The Rating Factor IENG 301 Fundamentals of Work Study and Ergonomics.” Available: https://staff.emu.edu.tr/orhankorhan/Documents/courses/ieng301-mane301/Lecture-Notes/spring2019-2020/CH21.pdf
[2] C. Team, “Work Allowance Calculation: What They Are and How They Affect Standard Time,” Cronometras: App de Cronometraje Industrial y Métodos y Tiempos, Apr. 25, 2025. https://cronometras.com/en/blog/work-allowance-calculation/ (accessed Jan. 04, 2026).

You must be logged in to post a comment.